Accessing and Interpreting Data Analytics in Echo360
Anyone with the role of 'instructor' for courses in Echo360 can see analytics (e.g., video views, polling responses, etc.).
How do you know if you are an instructor for a course section in Echo360? After you log in to Echo360 and navigate to a course, those with the instructor role see tabs on the upper right of the screen that include 'polling', 'settings', 'analytics', etc. If you do not see your course at all when you log in to Echo360, contact the director of instructional design and learning innovation or a coordinator for help.
To get to specific courses within Echo360, navigate to http://echo360.org and log in with your UIC credentials.
- Select the Courses tab on top and locate the one you want. Note: each block and elective course has at least three sections - one for each year and campus.
- Open the course by selecting it from the list.
- Access data points associated with this course by selecting the Analytics tab on top right.
If you need help or guidance, please reach out to the director of instructional design and learning innovation or your coordinators.
The Office of Educational Affairs also keeps track of these data points and downloads it to spreadsheets which can be shared with you. Echo360 data for each block course is downloaded approximately 3-4 weeks after the final exam. The data on these spreadsheets represents static analytics by class year and includes each block and campus.
Class and Student Analytics Heading link
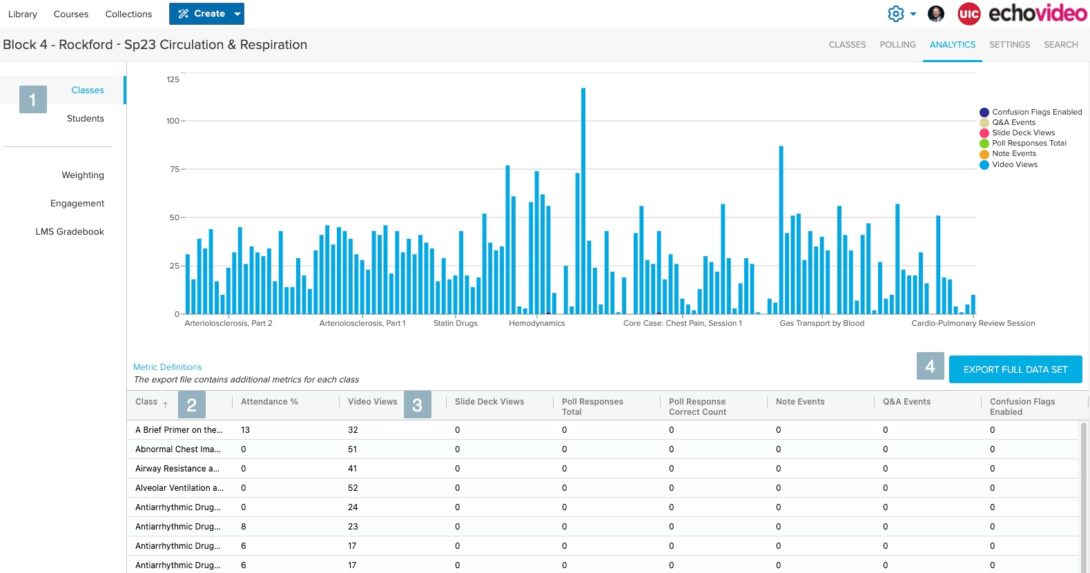
This screenshot shows what the Analytics tab looks like for a specific course. In Echo360 language, the term classes refers to individual videos, whether they are pre-recorded or scheduled recordings.
- Choose either Classes or Students. If you choose Classes, the results will show a bar chart of views (plus other data with a legend identifying data points).
- Sort the columns below the bar chart alphabetically by clicking on column headers.
- Note: if you click on the name of any video in a row, you will be presented with students who watched (or did not watch) that video.
- The column we most focus on is Video Views. This is how Echo360 describes these metrics:
- If viewing the Classes tab, this is the total number of times the video in the class was viewed by students in the section.
- If viewing the Students tab, this is the number of times each listed student viewed videos in the section, either for all classes or for a particular class if viewing student details or the export.
- Export the entire data set to create tables and bar charts. Be mindful if you download data as it will sometimes include student names.
If the Students tab on the left is selected, the results are presented with student names first. Selecting a student name will show a list of videos in the block course and whether the student watched them or not.
Accessing and Interpreting Polling Analytics Heading link
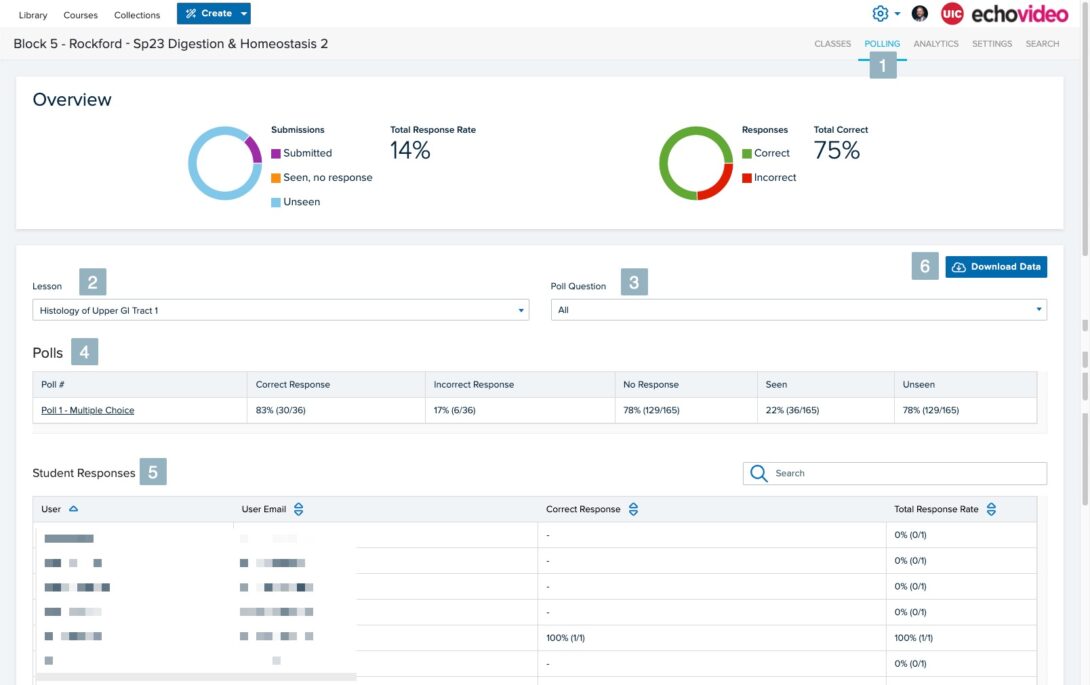
In this screenshot, you can see polling data. At least one video for the block course must have embedded polling, otherwise this page will be blank. Note that polling can be a multiple-choice question, fill-in-the blank, an image question, etc,)
- Select Polling to access polling analytics.
- Lesson: this shows a list of any videos (lessons) that contain at least one embedded poll.
- Poll Question: For the lesson (video) you selected, this will show all polls embedded in the video. If there is only one poll, it will show just one, for example.
- Polls: This gives you a breakdown of each poll embedded in the video. The user count is skewed because we allow students from all three campuses to access videos from whatever campus they choose. For example, a Rockford student may choose to watch videos from their ‘home’ campus as well as some videos from Peoria and/or Chicago. This also affects the overall data in the overview. The engagement might appear low and you have to take into account how many users are accessing the content.
- Student Responses: This is where you can see if a student has responded to the poll and the last time they viewed the video / responded to the poll. This data is similar to overall video view data – they have to watch the video to respond to a poll.
- Download Data: Student data alert – this contains sensitive data, including student usage
How to Interpret Echo360 Data Metrics Heading link
Of the analytics Echo360 provides, we look specifically at the following data areas due to how we use the resource.
The descriptions of the metrics come directly from Echo360 and is accurate as of June 2023.
For each .xslx file in the Box folder (e.g., Echo360 Views Classes Blocks 1-8 Class of [xxxx]), there are three tabs on the bottom, one for each campus / block. For example, data for Block 1 is shown as B1C, B1P, B1R to represent Block 1 and campus (Chicago, Peoria, Rockford). Access to the Box can be provided to you – ask the director of instructional design and learning innovation to be added.
Classes
- Total Engagement: A sum of all of these counts for all students who have engaged with this class. This includes: Video Views, Slide Deck Views, Polling Responses, Q&A Entries, Note Events, and Confusion markers.
- Attendance %: Attendance is determined by whether or not the student interacted with anything in the classroom at any time (viewed the video or slide deck, posted a Q&A entry, or took notes).For each class/each student, this metric is either 0% or 100%. Aggregated data is averaged over the number of classes or students included in the data shown. The percentage of enrolled students who attended (have 100% attendance for) each listed class. Note: data is aggregated over the number of classes or students shown. For example: if there are 180 students in a class and 20 students viewed (attended) the class, total engagement would be 7%.
- Video Views: The number of times students have viewed a video. The total number of times the video in the class was viewed by students in the section.
- Video View %: Percentage of class videos that have been viewed. Percentage of each class’ video that has been viewed, averaged across all students in the section.
- Poll Question Count: This is the total number of polling questions in this class.
- Poll Response Total: This is the total number of polling questions students in the course have submitted a response to.
- Poll Response Correct Total: The number of correct responses given for polling questions in each class by all students in the course.
- Poll Response Incorrect Total: The number of incorrect responses (or no response) given for polling questions in each class by all students in the course.
Students
- Total Engagement: A sum of all of these counts for all students who have engaged with this class. This includes: Video Views, Slide Deck Views, Polling Responses, Q&A Entries, Note Events, and Confusion markers.
- Attendance %: Attendance is determined by whether or not the student interacted with anything in the classroom at any time (viewed the video or slide deck, posted a Q&A entry, or took notes).For each class/each student, this metric is either 0% or 100%. Aggregated data is averaged over the number of classes or students included in the data shown. The percentage of enrolled students who attended (have 100% attendance for) each listed class. Note: data is aggregated over the number of classes or students shown. For example, if a student viewed 7 out of 50 classes (recordings), total engagement would be 14%.
- Video Views: The number of times students have viewed a video. The total number of times the video in the class was viewed by students in the section.
- Video View %: Percentage of class videos that have been viewed. Percentage of each class’ video that has been viewed, averaged across all students in the section.
- Poll Question Count: This is the total number of polling questions in each class and across the classes in the section.
- Poll Responses Total: This is the total number of polling questions each listed student responded to, either for all classes or for a particular class if viewing student details or the export.
- Poll Response Correct Count: The number of correct responses given by each student, either for each class or rolled up for the course.
- Poll Response Incorrect Total: The number of incorrect responses (or no response) given by each student, either for each class or rolled up for the course.