Accessing and Interpreting Data Analytics in Osmosis
Osmosis is widely used among our students, faculty, and staff. Only specific faculty and staff can access the analytics portion of the resource. Please consult with the Director of Instructional Design and Learning Innovation if you would like access to it or just want to review the data provided.
Osmosis Data Analytics Heading link
For those who have access to the Analytics section in Osmosis:
- Navigate to the workspace you would like to review. You must already have access to the workspace to select it.
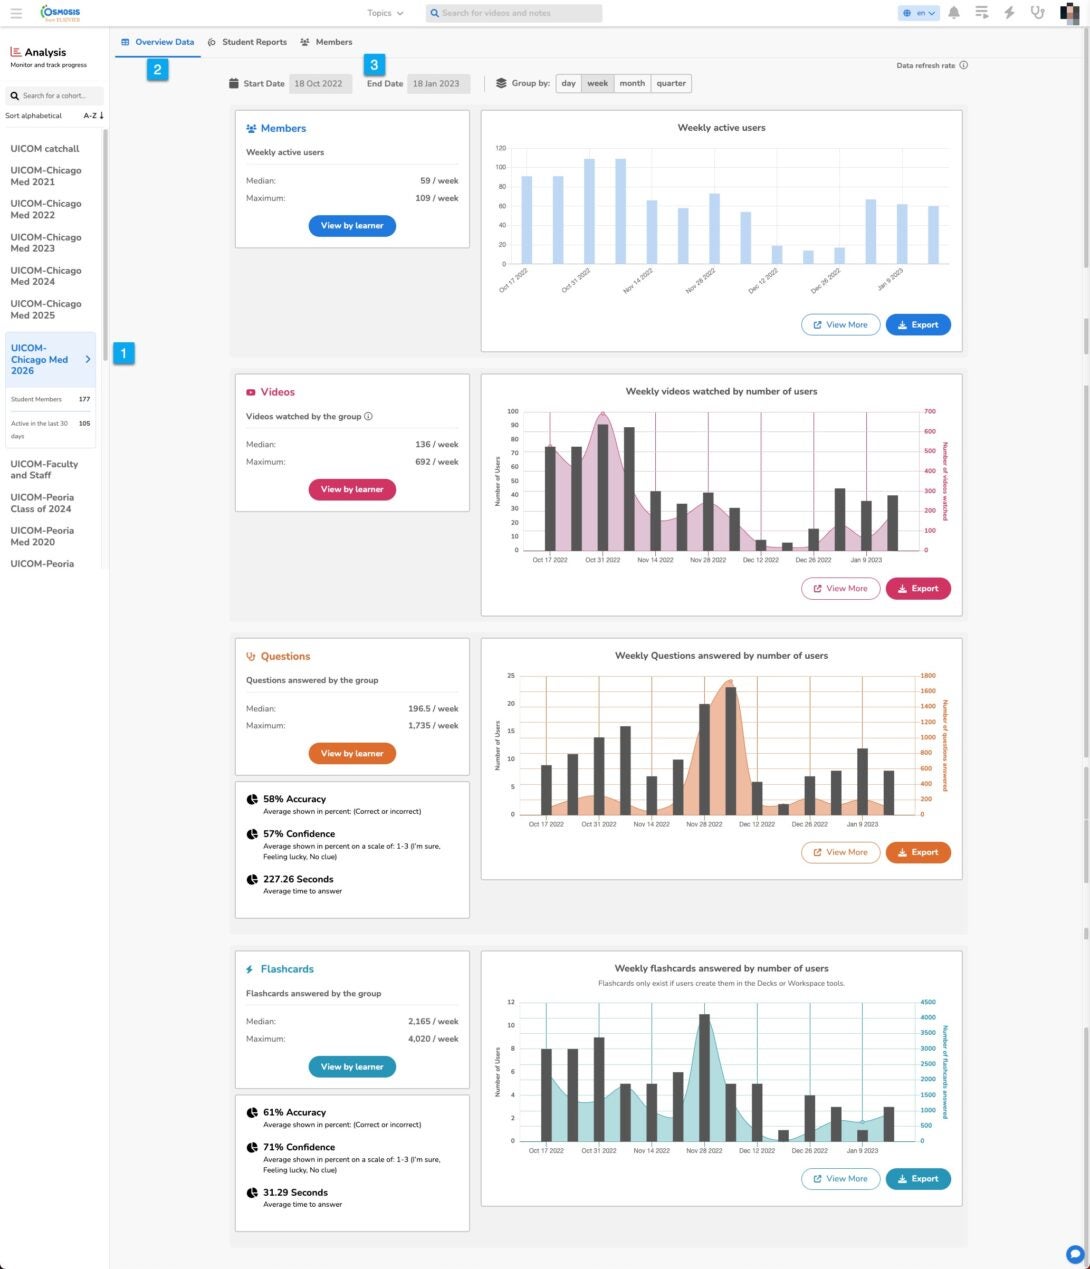
- Choose from Overview Data, Student Reports, or Members.
- Overview Data presents you with ‘in general’ information about student usage in the workspace, including how many videos watched, questions, and flashcards.
- Student Reports presents you with more specific data that comes from the overall Library (drill down to specific topics) or the Playlists created for each week in each block course.
- Members presents you with specific data about each student.
- Set date parameters for the data. Note the data range changes depending on which tab you are looking at (Overview Data, Student Reports, or Members).